
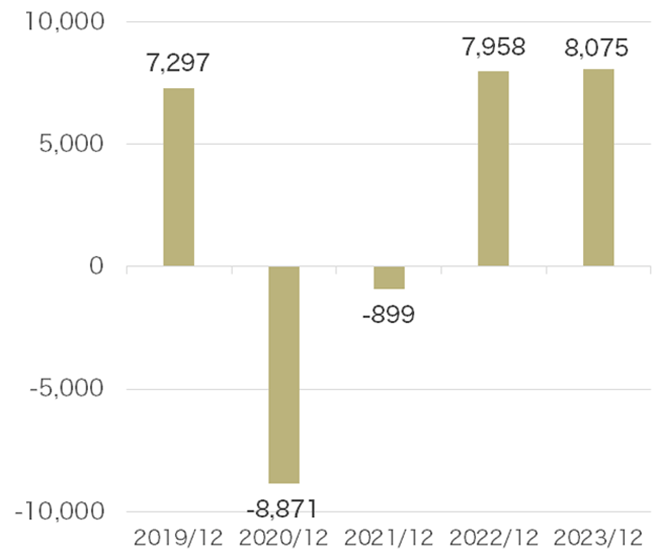
Operating Cash Flow
(millon yen)
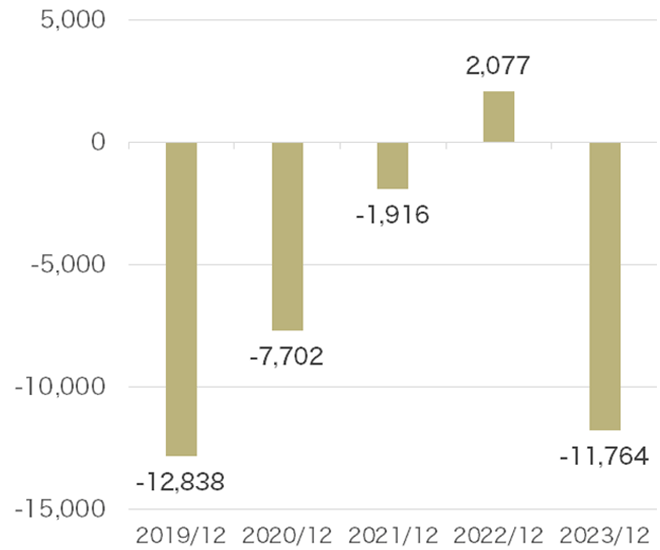
Investing Cash Flow
(millon yen)
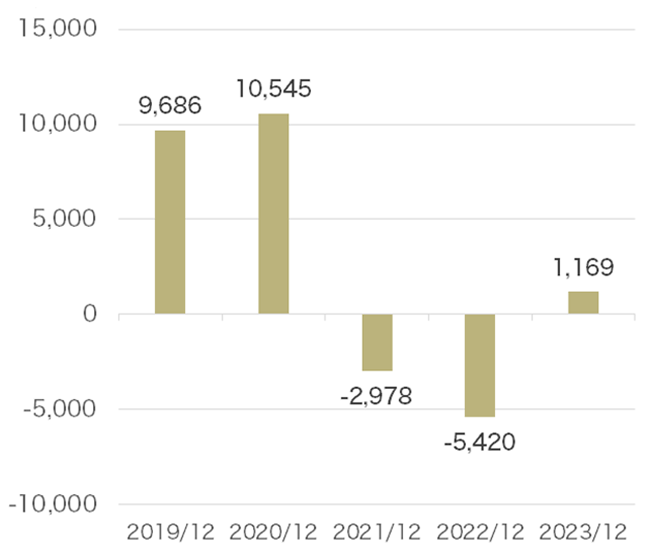
Financing Cash Flow
(millon yen)
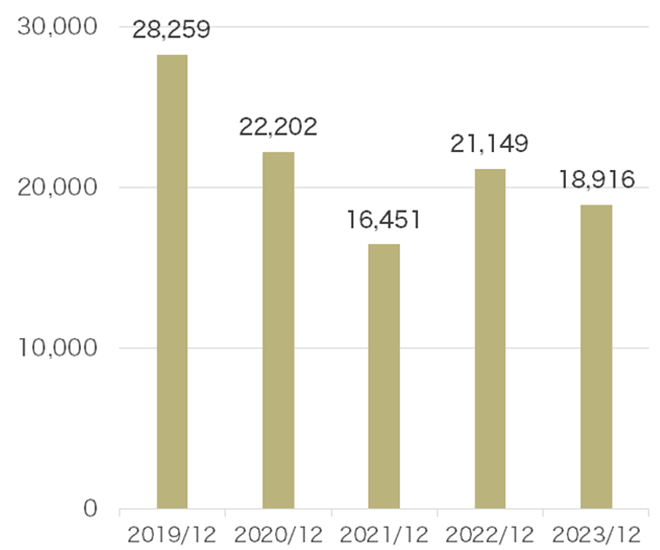
Cash and Equivalents at End-Term
(millon yen)
| 2019/12 | 2020/12 | 2021/12 | 2022/12 | 2023/12 | ||
|---|---|---|---|---|---|---|
| Operating Cash Flow (¥1 million) |
Full Year | 7,297 | -8,871 | -899 | 7,958 | 8,075 |
| Investing Cash Flow (¥1 million) |
Full Year | -12,838 | -7,702 | -1,916 | 2,077 | -11,764 |
| Financing Cash Flow (¥1 million) |
Full Year | 9,686 | 10,545 | -2,978 | -5,420 | 1,169 |
| Cash and Equivalents at End-Term (¥1 million) |
Full Year | 28,259 | 22,202 | 16,451 | 21,149 | 18,916 |
